Power to the People – Progress Report
Every so often, we like to peer into the particular details of U.S. power generation and statistics, here are the current numbers:
What is U.S. electricity generation by energy source?
In 2022, about 4,243 billion kilowatthours (kWh) (or about 4.24 trillion kWh) of electricity were generated at utility-scale electricity generation facilities in the United States.1 About 60% of this electricity generation was from fossil fuels—coal, natural gas, petroleum, and other gases. About 18% was from nuclear energy, and about 22% was from renewable energy sources.
The U.S. Energy Information Administration estimates that an additional 58 billion kWh of electricity generation was from small-scale solar photovoltaic systems in 2022.2
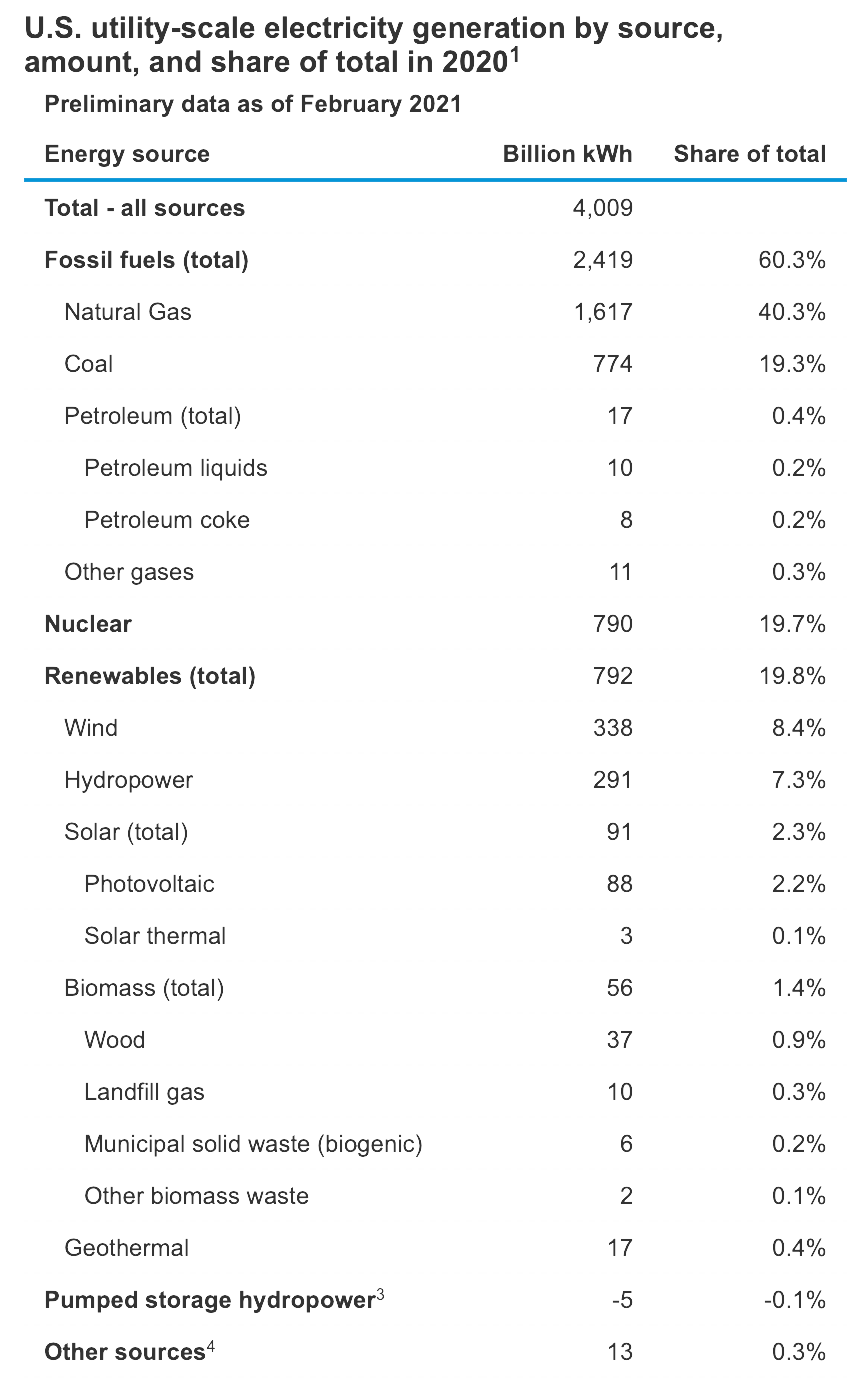
U.S. utility-scale electricity generation by source, amount, and share of total in 20221
Data as of February 2023
| Energy source | Billion kWh | Share of total |
|---|---|---|
| Total – all sources | 4,243 | |
| Fossil fuels (total) | 2,554 | 60.2% |
| Natural gas | 1,689 | 39.8% |
| Coal | 828 | 19.5% |
| Petroleum (total) | 23 | 0.6% |
| Petroleum liquids | 16 | 0.4% |
| Petroleum coke | 7 | 0.2% |
| Other gases3 | 12 | 0.3% |
| Nuclear | 772 | 18.2% |
| Renewables (total) | 913 | 21.5% |
| Wind | 435 | 10.2% |
| Hydropower | 262 | 6.2% |
| Solar (total) | 146 | 3.4% |
| Photovoltaic | 143 | 3.4% |
| Solar thermal | 3 | 0.1% |
| Biomass (total) | 53 | 1.3% |
| Wood | 37 | 0.9% |
| Landfill gas | 9 | 0.2% |
| Municipal solid waste (biogenic) | 6 | 0.1% |
| Other biomass waste | 2 | 0.1% |
| Geothermal | 17 | 0.4% |
| Pumped storage hydropower4 | -6 | -0.1% |
| Other sources5 | 11 | 0.3% |
Source: eia.gov


